Depot charging, whole-home energy, grid flexibility and vehicle-to-grid, in service.
How the AmpVerve platform runs a London borough council’s electric fleet depot, two connected homes with solar, batteries, heat pumps and electric vehicles, the utility control chain at the V2G Forum interoperability testbed, and the International Energy Agency’s vehicle-to-grid research programme.
Unmanaged: 148 kW from 17:30 for about 3.4 hours
Scheduled: 71 kW from 00:00 to 07:00
Connection capacity freed, about 75 kW
Reference depot, 20 vans: charging demand over 24 hours, modelled with the AmpVerve planning engine.
4,427depot charging sessions analysed for one public sector fleet
1,110 of 1,110meter readings accepted by a utility server over IEEE 2030.5
39utility controls relayed to charging equipment, up to 4.8 kW of measured discharge
5manufacturers’ devices planned as one system in a connected home
Case studyPublic sector fleetLondonLive pilot
Planning a London borough council’s electric fleet depot around every vehicle’s next departure
A London borough council runs about 30 electric fleet vehicles from one depot, every one of which must leave charged for its round. AmpVerve was engaged to establish what planned charging and grid flexibility are worth at the site, starting with a 90-day evidence phase that changes nothing about how the depot runs.
Fleet
About 30 electric fleet vehicles
Data sources
Vehicle telematics, half-hourly site metering, charger session records
Sessions analysed
4,427 (December 2025 to April 2026)
Engagement
90-day evidence phase, then controlled charging on the existing chargers
Site works
None. Every feed is connected remotely
Standards
OCPP 1.6J and 2.0.1, settlement-grade half-hourly metering
Data flow of the depot pilot: three live feeds, one daily plan, compared with what actually happened.
What the pilot has delivered
Three data sources reconciled into one depot view: telematics, settlement-grade half-hourly metering and charger sessions, with no site works.
A daily charging plan for every vehicle, worked back from its next departure and held inside the site’s import capacity, compared each day with what actually happened.
An evidence pack on a tamper-evident audit trail from day one, so the measured phase starts from a baseline the council has agreed.
The challenge
Fleet electrification turns the depot’s grid connection into the limiting asset. Charging that starts when vehicles return lands on the evening peak and uses most of the available capacity, and any plan that risks a missed round is not a saving. The council needed evidence it could take through procurement before it changed anything on site.
Stage 24,427 historical sessions analysed. Connection, charger and duty-cycle picture built for the depot.
Stage 3Daily charging plan running against live data, compared with actual every day.
Stage 4Measured report against the agreed baseline, then controlled charging on the existing chargers.
The technical solution
Fleet telematics
The council’s telematics feed is polled at sub-minute intervals, with traction state of charge and charging status taken where the vehicle exposes them, so each vehicle’s readiness is known before its plan is made.
Metering and sessions
Half-hourly import data for the site and session records from the depot’s charge point management system give the load shape and the plug-in pattern. The control phase connects the chargers over OCPP 1.6J and 2.0.1, with no hardware replaced.
Planning engine
A departure-first schedule inside the site’s import limit, re-planned as vehicles return and prices change. Every instruction, input and meter reading is recorded on the audit trail that produces the monthly statement.
What’s next
Controlled charging across the depot after the measured phase, then flexibility income through NESO’s Demand Flexibility Service and DNO local flexibility, quoted per site once each route is confirmed.
Measured results from this depot are published with the council’s agreement.
Reference designLast-mile van depotGreat BritainReference design
Doubling the headroom of a 20-van depot without a new grid connection
A reference design for a 20-van last-mile depot, built with the planning engine that runs on live sites. It shows what departure-first scheduling does to peak demand, connection headroom and energy cost when every van still leaves full.
Fleet
20 electric vans, 7.4 kW chargers
Daily energy
500 kWh drawn from the grid each working day
Peak demand, unmanaged
148 kW, 17:30 to 21:00
Peak demand, scheduled
71 kW, 00:00 to 07:00
Additional vans on the same connection
About 10, keeping half the freed capacity in reserve
Energy cost reduction
£10,000 to £19,000 a year
Unmanaged: 148 kW from 17:30 for about 3.4 hours
Scheduled: 71 kW from 00:00 to 07:00
Connection capacity freed, about 75 kW
Charging demand over 24 hours for the reference 20-van depot, drawn from the modelling basis below.
The challenge
Vans return around 17:30 and plug in together. Charging lands on the evening peak at the highest prices and takes most of the depot’s connection, so adding vehicles looks like it needs a bigger supply and a long wait for the network operator.
The approach
Each charge is planned back from the van’s 07:00 departure, inside the connection limit, and moved into the cheapest overnight hours. Readiness is a hard limit in the engine: a van that needs charge gets it, and the schedule flexes around it.
What the study shows
Peak charging demand roughly halves, from 148 kW to about 71 kW, freeing about 75 kW of connection capacity.
Holding half of that as a safety margin leaves room for about 10 more vans charged in the same window, before any grid reinforcement.
The price gap between evening and overnight energy is worth £10,000 to £19,000 a year on this fleet, before any flexibility income.
Modelling basis
20 vans, each needing 25 kWh a day from the grid (about 75 miles at 3.3 miles per kWh, with charging losses), 250 working days a year.
Unmanaged: all vans start charging at 7.4 kW on arrival at 17:30, so 148 kW for about 3.4 hours.
Scheduled: the same 500 kWh delivered between 00:00 and 07:00, about 71 kW.
Cost range uses a non-domestic time-of-use price gap of 8p to 15p per kWh between evening and overnight energy (central 12p). Standing charges, capacity charges and VAT excluded.
Flexibility income is not included. It depends on the routes open to a site and is calculated per depot.
A depot’s result depends on its tariff, connection, building load and duty cycles. The free depot assessment uses the site’s own data in place of every figure here.
Case studyUtilities, vehicle-to-gridUnited StatesInteroperability demonstration
Utility controls relayed to EV chargers over IEEE 2030.5 at the V2G Forum interoperability testbed
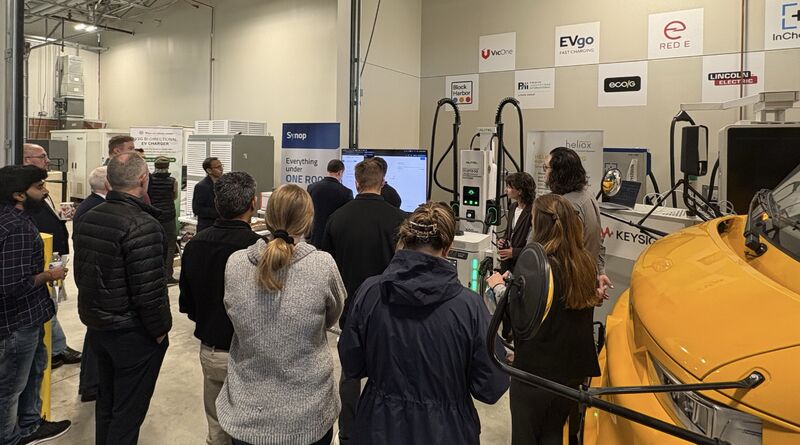
Utilities need to send grid controls to charging equipment from any manufacturer and know that each control arrived, was acted on and was reported back. AmpVerve took the aggregator role in the AC demonstration of the V2G Forum interoperability testbed, alongside PNNL, Emporia and Pacific Power, with the demonstration in Detroit on 27 to 29 October 2026.
Role
Aggregator, AC demonstration
Partners
PNNL, Emporia, Pacific Power
Standard
IEEE 2030.5 (CSIP)
Utility controls received and relayed
39
Responses and meter readings accepted
171 of 171 responses, 1,110 of 1,110 readings
Measured discharge
Up to 4.8 kW in the test setup, every set point checked against measured power
Control chain at the V2G Forum AC interoperability testbed, with the counts reported from the demonstration.
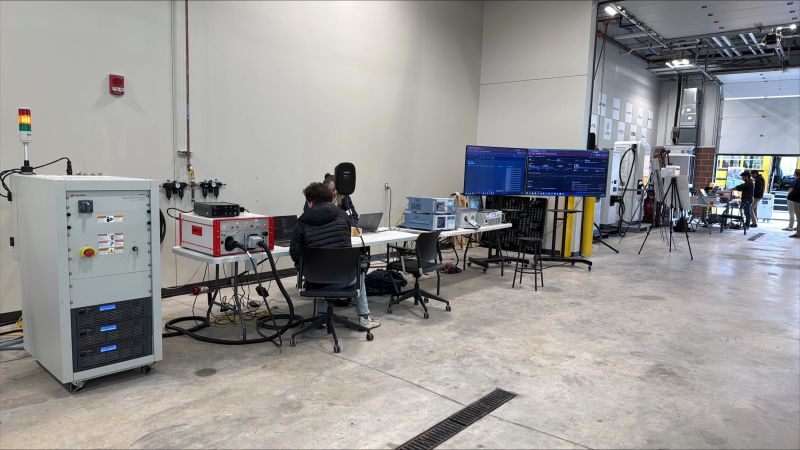
Partners and manufacturers at the AC demonstration in Detroit. AmpVerve’s post on LinkedIn.The AC test bench at the American Center for Mobility, Ypsilanti Township, Michigan, with up to 4.8 kW of measured discharge. The founder’s post on LinkedIn.
What we proved
A utility-to-charger control chain over an open standard, with no proprietary link between the utility server and the charging equipment.
Every control tracked through each stage on its own: received, acknowledged, executed and reported, so the evidence holds up at each step.
Status and metering reported back to the utility server and accepted in full.
The challenge
Most vehicle-to-grid projects prove the control chain with one vendor’s equipment end to end. Utilities planning programmes at scale need the same chain to work across manufacturers, with evidence they can audit, before they can trust it.
The technical solution
IEEE 2030.5 client
AmpVerve’s client registers with the utility server, receives DER controls and schedules, and acknowledges each one with its lifecycle status.
Relay to charging equipment
Controls are translated to the charging equipment’s own interface, executed against the live power set point and verified against measured power.
Metering and evidence
Mirror usage point readings and DER status are posted back to the utility server, and a relay evidence log records each stage for the partners’ review.
What’s next
The same server and client are the basis of AmpVerve’s vehicle-to-grid capability for fleets, homes and buildings as bidirectional vans and chargers reach the market, and of the utility programmes AmpVerve takes part in through its US market-access partner.
Case studyResearch programme, dynamic network tariffsSwitzerland and the NetherlandsResearch programme
An explainable bidirectional charging schedule against a 15-minute network tariff, for IEA Task 53
Primeo Energie’s dynamic network tariff changes price every 15 minutes. IEA Task 53, the International Energy Agency’s vehicle-to-grid research programme, asked how a bidirectional vehicle could follow it and still leave with the charge its driver needs. AmpVerve built and presented the answer.
Programme
IEA Task 53, third workshop
Host and date
ElaadNL, Arnhem, 7 September 2026
Tariff
Primeo Energie dynamic network tariff, 96 quarter-hour prices
Schedule
12 setpoints across 8 power levels
Battery band
45% to 80% state of charge
Energy over the day
40.5 kWh in, 16.6 kWh out
Price curve (illustrative shape)
Charging intervals
Discharging intervals
12 setpoints
8 power levels
45% to 80% state of charge
Price curve drawn as an illustrative shape; the schedule figures are the study’s.
What we delivered
A constrained optimisation that turns the day’s 96 prices into one schedule, allowing for charge taper and the driver’s departure requirement.
Exports in the forms operators use: setpoints, a full 96-interval file and a JSON audit record, so every setpoint traces back to a price.
Charging in the cheapest intervals and discharging into the dearest, presented to the Task 53 participants at ElaadNL.
Why it matters
A tariff that changes every 15 minutes is only useful to a fleet if the resulting schedule can be explained to the people who run it. The same explainability is what AmpVerve’s monthly statements rest on: each instruction traceable to the input that caused it.
Study basis
Primeo Energie network tariff published for 28 August 2026, 96 quarter-hour intervals.
A representative 60 kWh vehicle battery and an 11 kW each-way charger.
Presented to the Task 53 participants at the ElaadNL workshop; the same engine runs AmpVerve’s bidirectional scheduling.
Case studyConnected home, vehicle-to-homeOxfordshireLive pilot
A bidirectional home: a 40 kWh van battery, rooftop solar and a heat pump measured as one system
A detached family home runs rooftop solar, an air-source heat pump, three electric vehicles and a bidirectional charger that uses a 40 kWh electric van as the house battery, on a time-of-use tariff with cheap overnight power and a flat export rate. AmpVerve connected the smart meter, the charger and the vehicles, measured the house every half hour, and showed the owner exactly where the money was.
Assets
Rooftop solar, air-source heat pump, bidirectional charger with a 40 kWh electric van as the home battery, two further EVs
Tariff
Intelligent time-of-use import with a six-hour overnight window, flat export
Data
Supplier half-hourly meter feed, charger telemetry, vehicle manufacturer cloud
Measured period
44 consecutive days, 48 half hours a day, every reading present in both feeds
Charger round trip
86.7% measured, 23 to 27 kWh usable per cycle
Site works
None. Every feed is connected remotely
What the pilot delivered
One half-hourly picture of the house from two independent sources, the supplier’s meter feed and the charger’s own telemetry, reconciled interval by interval.
A control gap in the charger’s load-matching worth about £244 a year, invisible in the charger’s app, documented and taken to the manufacturer.
A re-timed charge and discharge schedule that keeps the van ready for its departures, and a measured ceiling for further gains: up to £286 a year more with half-hourly closed-loop control.
The challenge
A house with solar, a heat pump, three vehicles and a bidirectional charger has four schedules and four apps, none of which can see the others. The owner wanted to know whether the charger’s discharge window, the tariff windows and the household’s real load lined up, and what a better plan was actually worth before anything changed.
The technical solution
Settlement-grade metering
Import and export are read every half hour from the supplier’s feed, so every saving is measured against the same data the bill is settled on.
Charger and vehicle feeds
The bidirectional charger reports power and state of charge; the vehicles report through their manufacturers’ cloud services. Departures are learned from the pattern, so the van is never emptied before it is needed.
Whole-home plan
Charge, discharge, heat pump and vehicle charging are planned together inside the tariff windows and the owner’s comfort limits, with every instruction and reading kept on the audit trail behind the weekly statement.
What’s next
Grid events through the AmpVerve app as each route is confirmed for the home, with the van battery, the heat pump and vehicle charging offered together.
Case studyConnected home, whole-houseStaffordshireLive pilot
Five manufacturers, one plan: battery, solar, heat pump, charger and EV connected without a site visit
A family home runs a Tesla Powerwall 3 with 5.28 kWp of solar on its hybrid inverter, a 6 kW Octopus Cosy heat pump, a myenergi Zappi charger and a Volkswagen ID. Buzz, on a 100 A connection in the West Midlands. AmpVerve connected all of it through manufacturer and supplier cloud links within two days and plans it as one system.
Assets
Tesla Powerwall 3 battery and 5.28 kWp solar, Octopus Cosy 6 kW heat pump, myenergi Zappi charger, Volkswagen ID. Buzz
Connection
100 A single phase, 11.4 kVA export limit, National Grid Electricity Distribution area
Integrations
Supplier smart-meter API, battery and charger through Enode, vehicle through Smartcar, heat pump through the supplier’s API
Time to connect
Two days, all five devices
Site works
None
Data
Half-hourly import and export, battery state, solar generation, charger sessions, vehicle state of charge, heat pump state
What the pilot delivered
One whole-house view across five manufacturers, each previously visible only in its own app.
A single daily plan: solar into the battery and the vehicle first, the heat pump kept inside the owner’s comfort limits, grid import moved into the cheapest hours, export held inside the connection’s limit.
A weekly statement in the AmpVerve app showing what was done and what it was worth, against the supplier’s own half-hourly data.
The challenge
The battery, the charger and the heat pump each optimise alone, and the vehicle charges whenever it is plugged in. Four controllers pulling in different directions on one 100 A supply means the cheapest hours are shared badly and the export limit is reached while the vehicle still needs charge.
The technical solution
Connection-first
Every device is connected through its manufacturer’s or supplier’s own cloud interface, with the owner’s consent, in minutes per device. Nothing is installed and nothing is replaced.
Per-home isolation
Each home is its own tenant on the platform: its credentials, data and plan are never shared with another organisation or household.
Planning engine
The same departure-first, limit-aware engine that plans fleet depots plans the home: vehicle ready by its departure, battery cycled for the tariff, heat pump inside comfort limits, export inside the connection.
What’s next
Grid events offered through the app as each route is confirmed for the home, with the battery, the heat pump and vehicle charging bid together, and the second vehicle connected the same way.
Programmes and recognition
Where the platform is tested and recognised.
V2G ForumAC interoperability testbed, aggregator role, with PNNL, Emporia and Pacific Power
IEA Task 53Contributor to the International Energy Agency’s vehicle-to-grid research programme
EPRI AI for Power Challenge 2026Pitch Day finalist, selected to pitch to EPRI’s utility members
NVIDIA InceptionMember since October 2026
ElexonBSC Party, MPID AMPV, for Great Britain’s balancing and settlement arrangements; qualification decision targeted for January 2027
Next step
See what your depot’s connection can really carry.
Start with a free depot assessment: how many more vehicles your connection can charge, what planned charging is worth on your tariff, and which flexibility routes apply to your site. The assessment and a 90-day pilot on your existing chargers are free. After the pilot, AmpVerve is paid only from a share of the savings and grid income it creates. If we deliver nothing, you pay nothing.
Modelled figures are stated with their basis. Measured results are published with each customer’s agreement, and every site is assessed on its own data.